HuntOps
8/02/2020 - Securing the Elastic Stack in RockNSM
As the Elastic Stack continues to release features for their Security App, they have enforced a requirement to have a secure configuration to take advantage of the finer points of this app; namely the Detection Engine.
Responding to multiple requests from the community, I wanted to drop a quick configuration guide on how to deploy the security configuration needed to allow access to the Detection Engine in the Security app (formerly the SIEM app).
Caveat: Click to PCAP (Docket) doesn’t work quite like it used to after you use this guide. It tries to send everything over port 5601. We’re working on a fix to this, but for now, if you do this, you’ll need to remove the port when you’re running Docket.
Additionally, you will have an outage while we’re configuring security, so plan accordingly.
Obviously, you need to have a ROCK deployment and I recommend having the most updated version of the Elastic Stack:
Let’s check to make sure that the sensor is healthy with rockctl status. If you have any services that are in a failed state, try restarting them with sudo systemctl restart [service]. Of note, STENOGRAPHER will show itself as being active (exited). This is normal. If you look down further, STENOGRAPHER@[INTERFACE] active (running) (in my case DUMMY0).
rockctl status
ZEEK:
    Active: active (running) since Sun 2020-08-02 13:56:10 UTC; 59s ago
STENOGRAPHER:
    Active: active (exited) since Sun 2020-08-02 13:55:40 UTC; 1min 29s ago
DOCKET:
    Active: active (running) since Sun 2020-08-02 13:55:38 UTC; 1min 31s ago
SURICATA:
    Active: active (running) since Sun 2020-08-02 13:55:40 UTC; 1min 29s ago
ELASTICSEARCH:
    Active: active (running) since Sun 2020-08-02 13:56:45 UTC; 24s ago
KIBANA:
    Active: active (running) since Sun 2020-08-02 13:55:37 UTC; 1min 32s ago
ZOOKEEPER:
    Active: active (running) since Sun 2020-08-02 13:55:40 UTC; 1min 29s ago
KAFKA:
    Active: active (running) since Sun 2020-08-02 13:55:43 UTC; 1min 26s ago
LIGHTTPD:
    Active: active (running) since Sun 2020-08-02 13:55:40 UTC; 1min 29s ago
FSF:
    Active: active (running) since Sun 2020-08-02 13:55:41 UTC; 1min 29s ago
FILEBEAT:
    Active: active (running) since Sun 2020-08-02 13:55:40 UTC; 1min 29s ago
LOGSTASH:
    Active: active (running) since Sun 2020-08-02 13:55:37 UTC; 1min 32s ago
STENOGRAPHER@DUMMY0:
    Active: active (running) since Sun 2020-08-02 13:55:40 UTC; 1min 29s ago
DOCKET-CELERY-IO:
    Active: active (running) since Sun 2020-08-02 13:55:37 UTC; 1min 32s ago
DOCKET-CELERY-QUERY:
    Active: active (running) since Sun 2020-08-02 13:55:37 UTC; 1min 32s ago
Next, we’re going to make some changes to Elasticsearch, Kibana, and Logstash.
Elasticsearch
Let’s check out to see what version we’re running by curling our system on the Elasticsearch port, 9200.
curl localhost:9200
{
  "name" : "rock-2-6",
  "cluster_name" : "rocknsm",
  "cluster_uuid" : "hSatkUXKS-uAT9ypnh1n8g",
  "version" : {
    "number" : "7.8.1",
    "build_flavor" : "default",
    "build_type" : "rpm",
    "build_hash" : "b5ca9c58fb664ca8bf9e4057fc229b3396bf3a89",
    "build_date" : "2020-07-21T16:40:44.668009Z",
    "build_snapshot" : false,
    "lucene_version" : "8.5.1",
    "minimum_wire_compatibility_version" : "6.8.0",
    "minimum_index_compatibility_version" : "6.0.0-beta1"
  },
  "tagline" : "You Know, for Search"
}
We can see that we’re on 7.8.1, which at the time of this writing, is the most current version.
Next let’s make a change to the Elasticsearch configuration file and add the following to /etc/elasticsearch/elasticsearch.yml (remember to open this file w/sudo)
xpack.security.enabled: true
xpack.security.authc.api_key.enabled: true
After you’ve made this change, restart Elasticsearch sudo systemctl restart elasticsearch.
When Elasticsearch comes back up and we try to curl it again, we get a different response telling us we need to authenticate - we’re on the right track.
curl localhost:9200 | jq
  % Total    % Received % Xferd  Average Speed   Time    Time     Time  Current
                                 Dload  Upload   Total   Spent    Left  Speed
100   403  100   403    0     0  53497      0 --:--:-- --:--:-- --:--:-- 57571
{
  "error": {
    "root_cause": [
      {
        "type": "security_exception",
        "reason": "missing authentication credentials for REST request [/]",
        "header": {
          "WWW-Authenticate": [
            "ApiKey",
            "Basic realm=\"security\" charset=\"UTF-8\""
          ]
        }
      }
    ],
    "type": "security_exception",
    "reason": "missing authentication credentials for REST request [/]",
    "header": {
      "WWW-Authenticate": [
        "ApiKey",
        "Basic realm=\"security\" charset=\"UTF-8\""
      ]
    }
  },
  "status": 401
}
Next we need to make come credential pairs.
You can let Elasticsearch generate your own credential pairs OR you can set them yourself. If you prefer to let Elastisearch create the passphrases for you, just remove the interactive operator below.
sudo /usr/share/elasticsearch/bin/elasticsearch-setup-passwords interactive
Initiating the setup of passwords for reserved users elastic,apm_system,kibana,kibana_system,logstash_system,beats_system,remote_monitoring_user.
You will be prompted to enter passwords as the process progresses.
Please confirm that you would like to continue [y/N]y

Enter password for [elastic]:
Reenter password for [elastic]:
Enter password for [apm_system]:
Reenter password for [apm_system]:
Enter password for [kibana_system]:
Reenter password for [kibana_system]:
Enter password for [logstash_system]:
Reenter password for [logstash_system]:
Enter password for [beats_system]:
Reenter password for [beats_system]:
Enter password for [remote_monitoring_user]:
Reenter password for [remote_monitoring_user]:
Changed password for user [apm_system]
Changed password for user [kibana_system]
Changed password for user [kibana]
Changed password for user [logstash_system]
Changed password for user [beats_system]
Changed password for user [remote_monitoring_user]
Changed password for user [elastic]
The passphrases we need are elastic, kibana_system, and logstash_system.
Logstash
Let’s check out to see what version we’re running the following command:
/usr/share/logstash/bin/logstash -V
logstash 7.8.1
We can see that we’re on 7.8.1, which at the time of this writing, is the most current version.
We need to add the username and passphrases we created above to the Logstash configuration in /etc/logstash/conf.d/logstash-9999-output-elasticsearch.conf (remember to open this file w/sudo).
For each block of elasticsearch, add the user => elastic and password => fields. There will be several.
Example
output {
  # Requires event module and category
  if [event][module] and [event][category] {

    # Requires event dataset
    if [event][dataset] {
      elasticsearch {
                    hosts => ["127.0.0.1:9200"]
                    user => elastic
                    password => password
                    index => "ecs-%{[event][module]}-%{[event][category]}-%{+YYYY.MM.dd}"
          manage_template => false
      }
    }
...
Next, go to /etc/logstash/logstash.yml and uncomment out (replace with the logstash_system passphrase you created)
xpack.monitoring.elasticsearch.username: "logstash_system"
xpack.monitoring.elasticsearch.password: "password"
Let’s test your configuration
sudo -u logstash -g logstash /usr/share/logstash/bin/logstash "--path.settings" "/etc/logstash" -t
Configuration OK
[2020-08-02T14:38:16,728][INFO ][logstash.runner] Using config.test_and_exit mode. Config Validation Result: OK. Exiting Logstash
Finally, let’s restart Logstash with sudo systemctl restart logstash.
Kibana
Let’s check out to see what version we’re running by curling Kibana’s API on port 5601.
curl -s http://localhost:5601/api/status | jq .version.number
"7.8.1"
We can see that we’re on 7.8.1, which at the time of this writing, is the most current version.
Next let’s make a change to the Kibana configuration file and add the following to /etc/kibana/kibana.yml (remember to open this file w/sudo).
Note: xpack.encryptedSavedObjects.encryptionKey just needs to be a 32-bit value, anything will work. For elasticsearch.password, enter the passphrase you created (or Elasticsearch created for you) in the previous step.
elasticsearch.username: "kibana_system"
elasticsearch.password: "password"
xpack.security.enabled: true
xpack.encryptedSavedObjects.encryptionKey: "lkajsdflkjadfoijeoiwerjlkdflkjasdfl;kkjs"
server.host: 0.0.0.0
After you’ve made this change, restart Kibana sudo systemctl restart kibana.
While you wait for Kibana to come up, we need to make a change to the firewall to allow us to access Kibana over it’s native port of 5601.
sudo firewall-cmd --add-port=5601/tcp --permanent
sudo firewall-cmd --reload
Check to make sure you can get to Kibana in your browser http://rock-ip:5601.
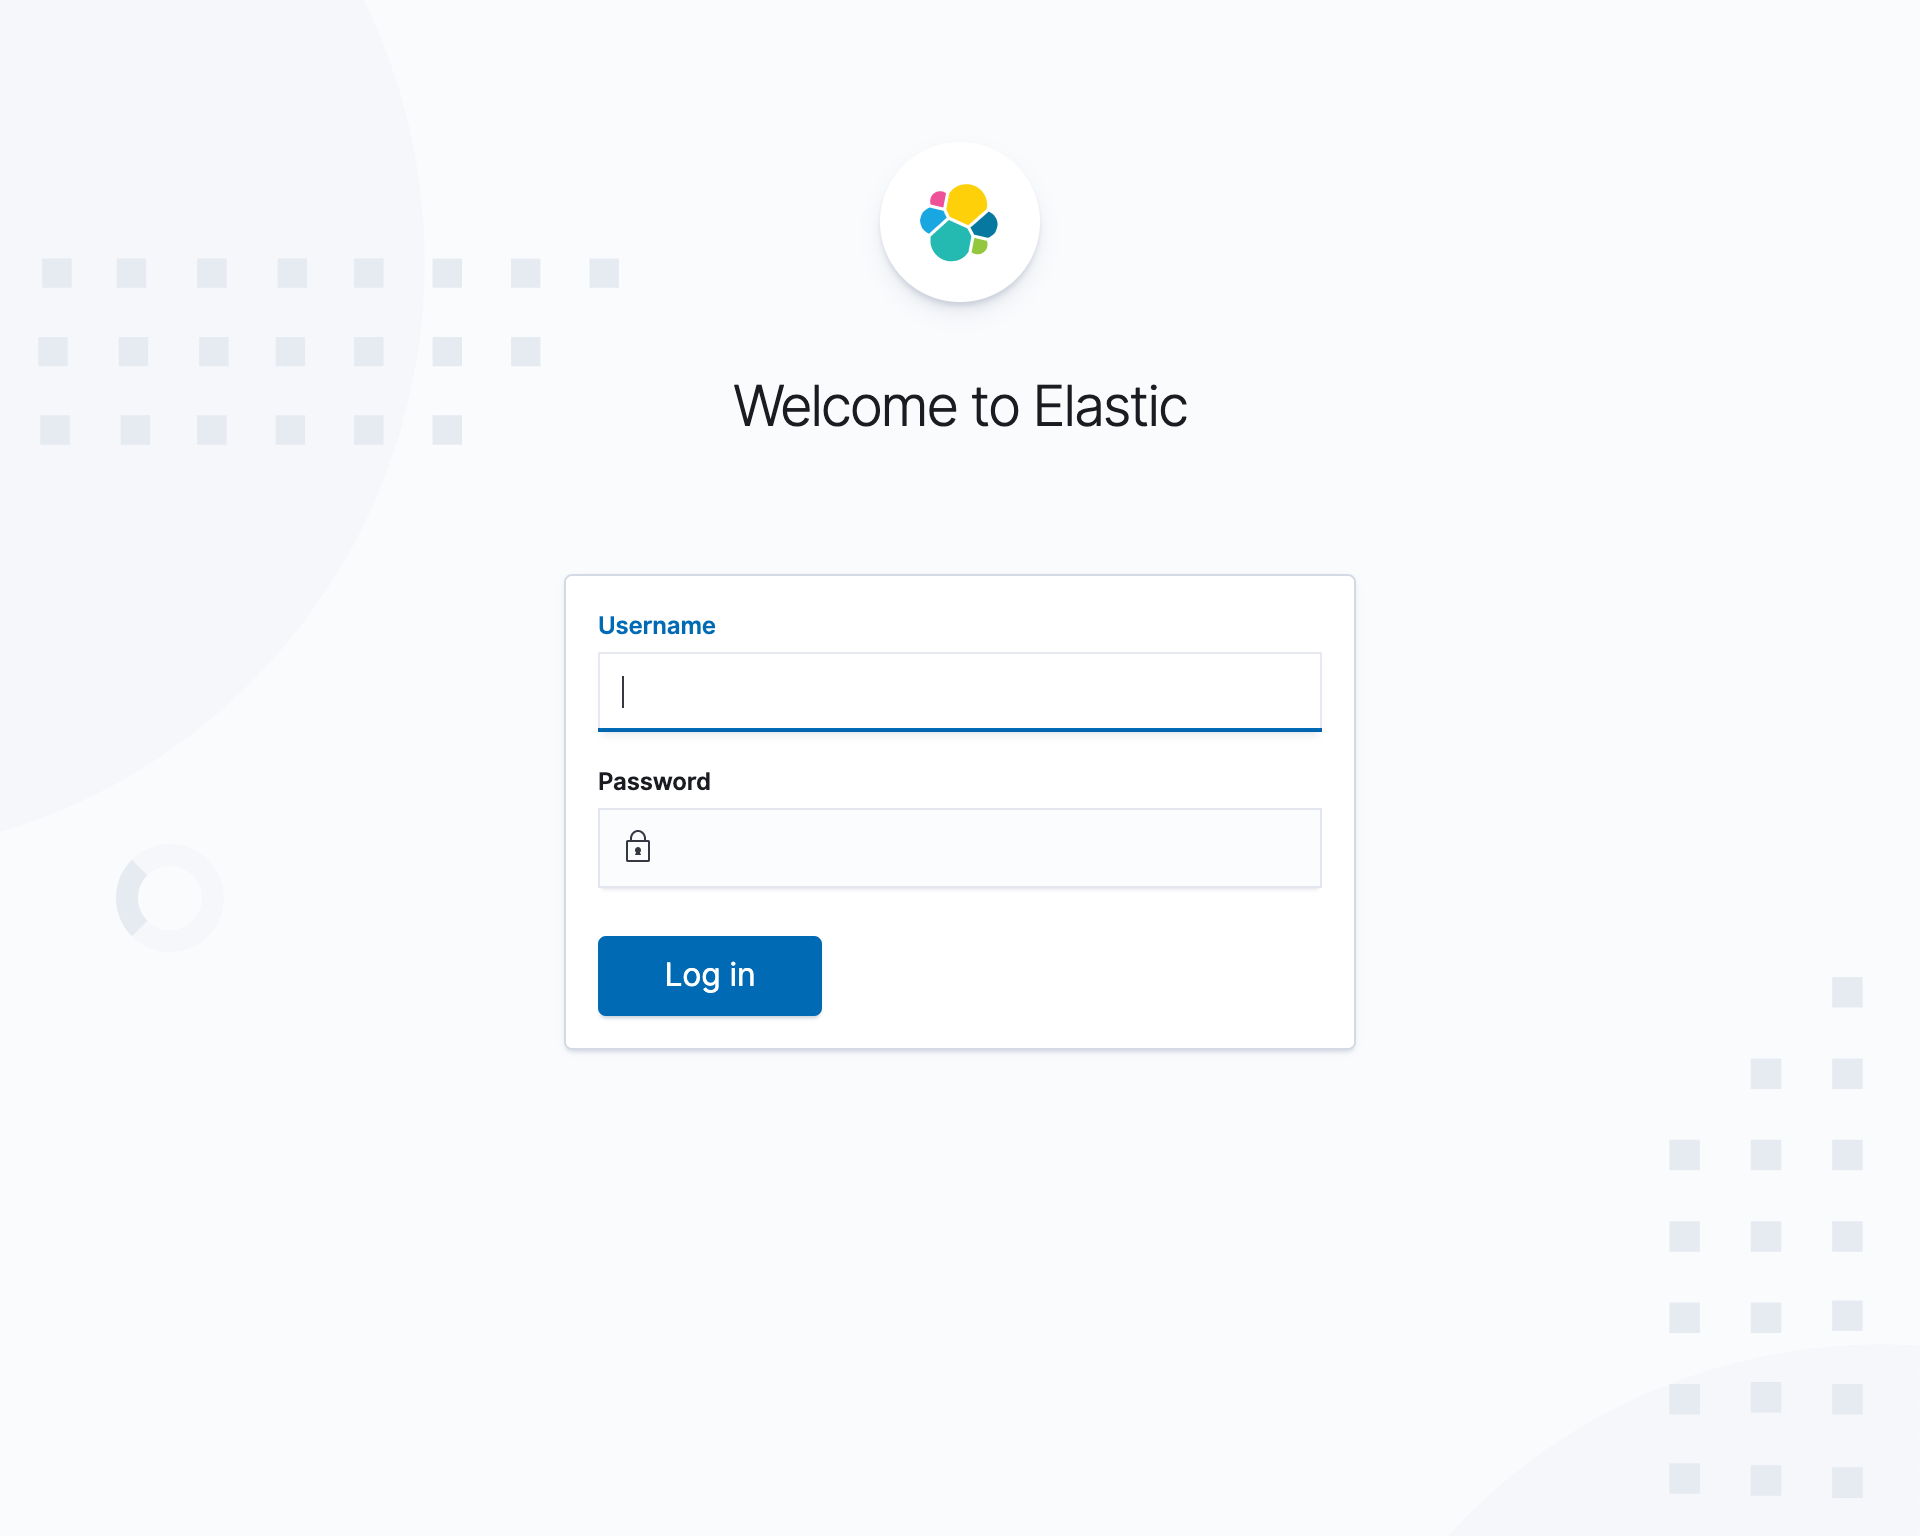
From here you’ll log on with the username of elastic and the passphrase you created above for that account.
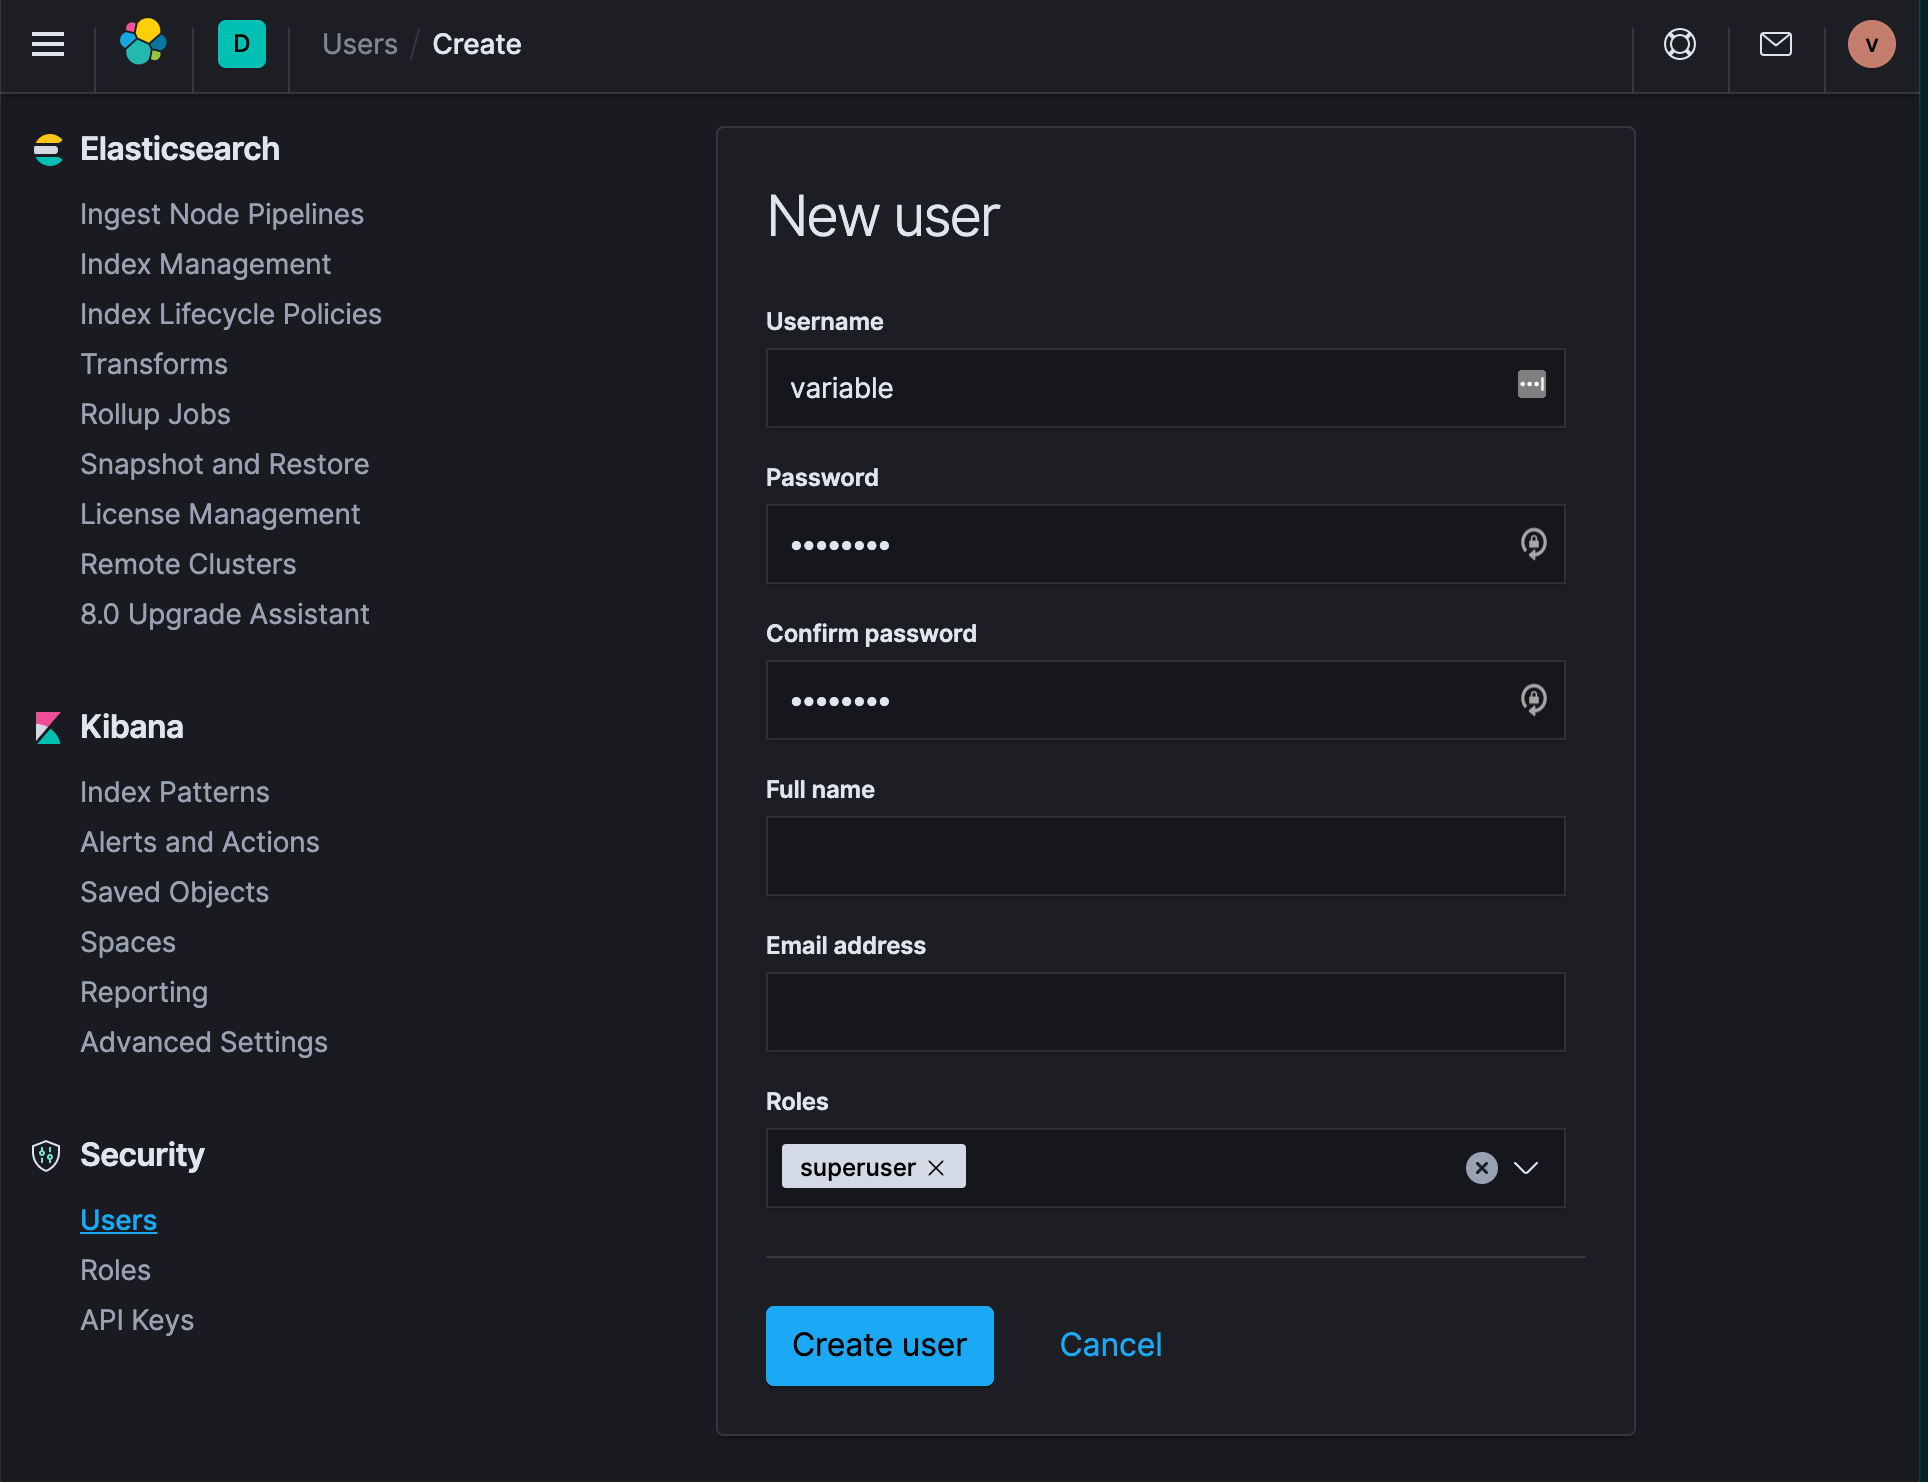
Once you’re logged into Kibana, we need to make another user so that lighttpd doesn’t clash with Kibana - this is hacky, once we figure out a better way, we’ll update this.
On the sensor, open ~/KIBANA_CREDS.README, that has a username and passphrase, we’ll need that in a minute.
- In Kibana, click on the Kibana Dock panel (hamburger menu in the top left)
- Click on Stack Management
- Click on Users
- Create User
- Name the user the
Uand the passphrase thePinKIBANA_CREDS.README- you’re creating a user in Kibana that has the same username and passphrase as the one in lighttpd - Give this user the role of
superuser - Log out and then log in with this account
Finally, let’s shut down port 5601 that we needed temporarily
sudo firewall-cmd --remove-port=5601/tcp --permanent
sudo firewall-cmd --reload
Test Data
Lets test the sample data listed at the top of the page and replay it to test everything (instructions at the top).
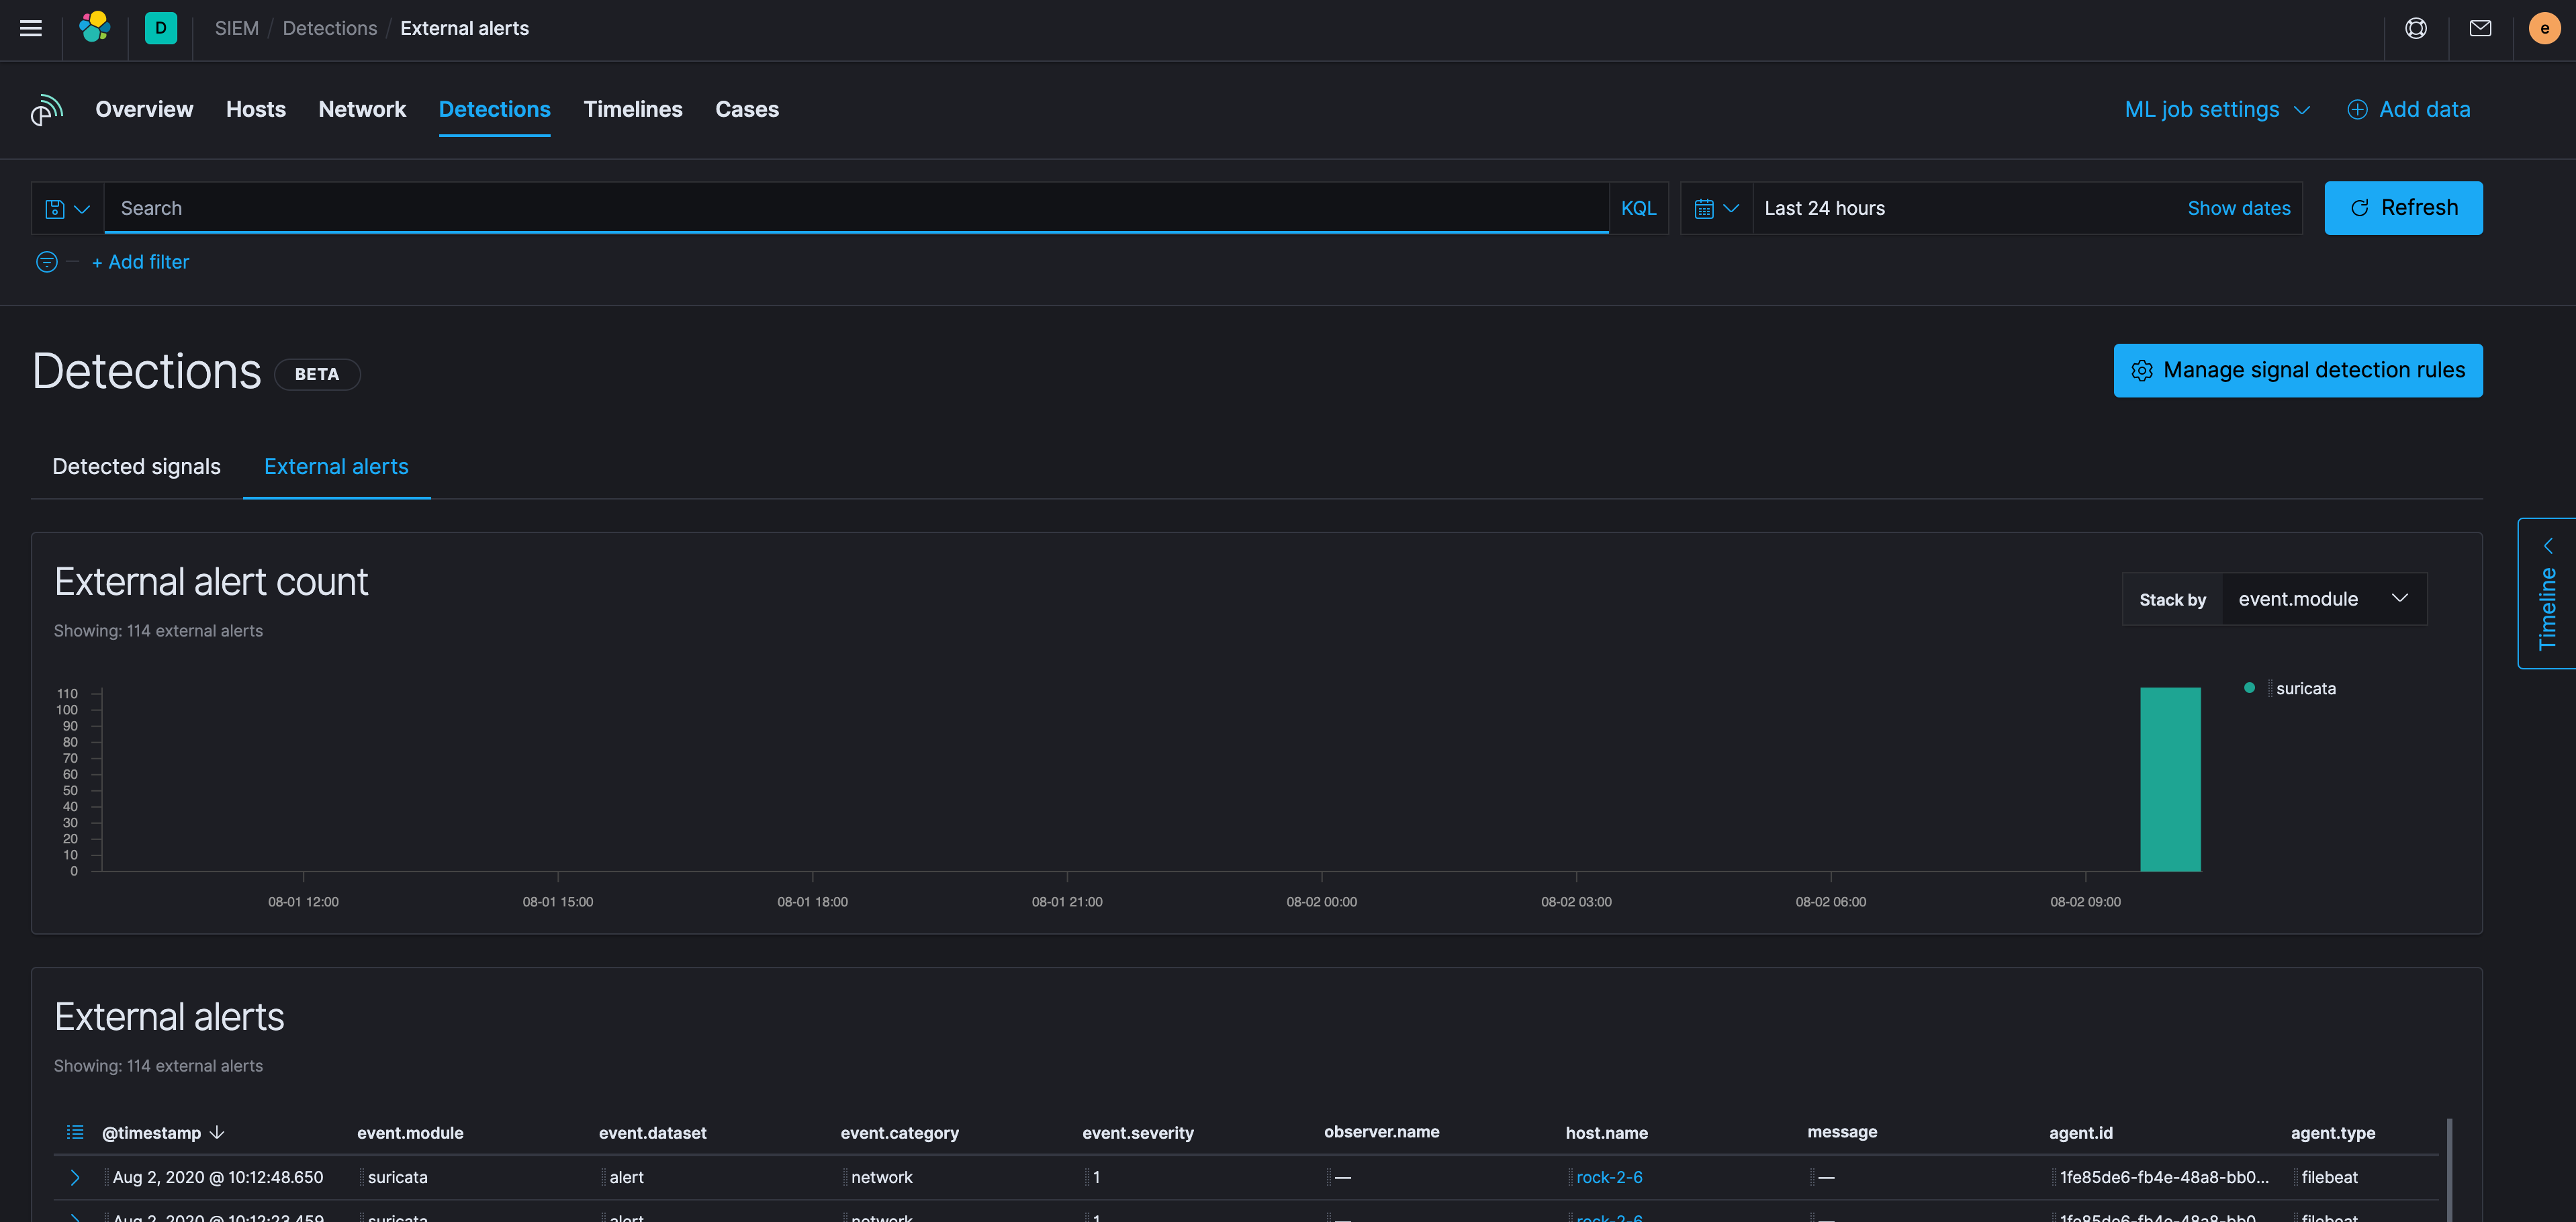
Looks good, and happy hunting!
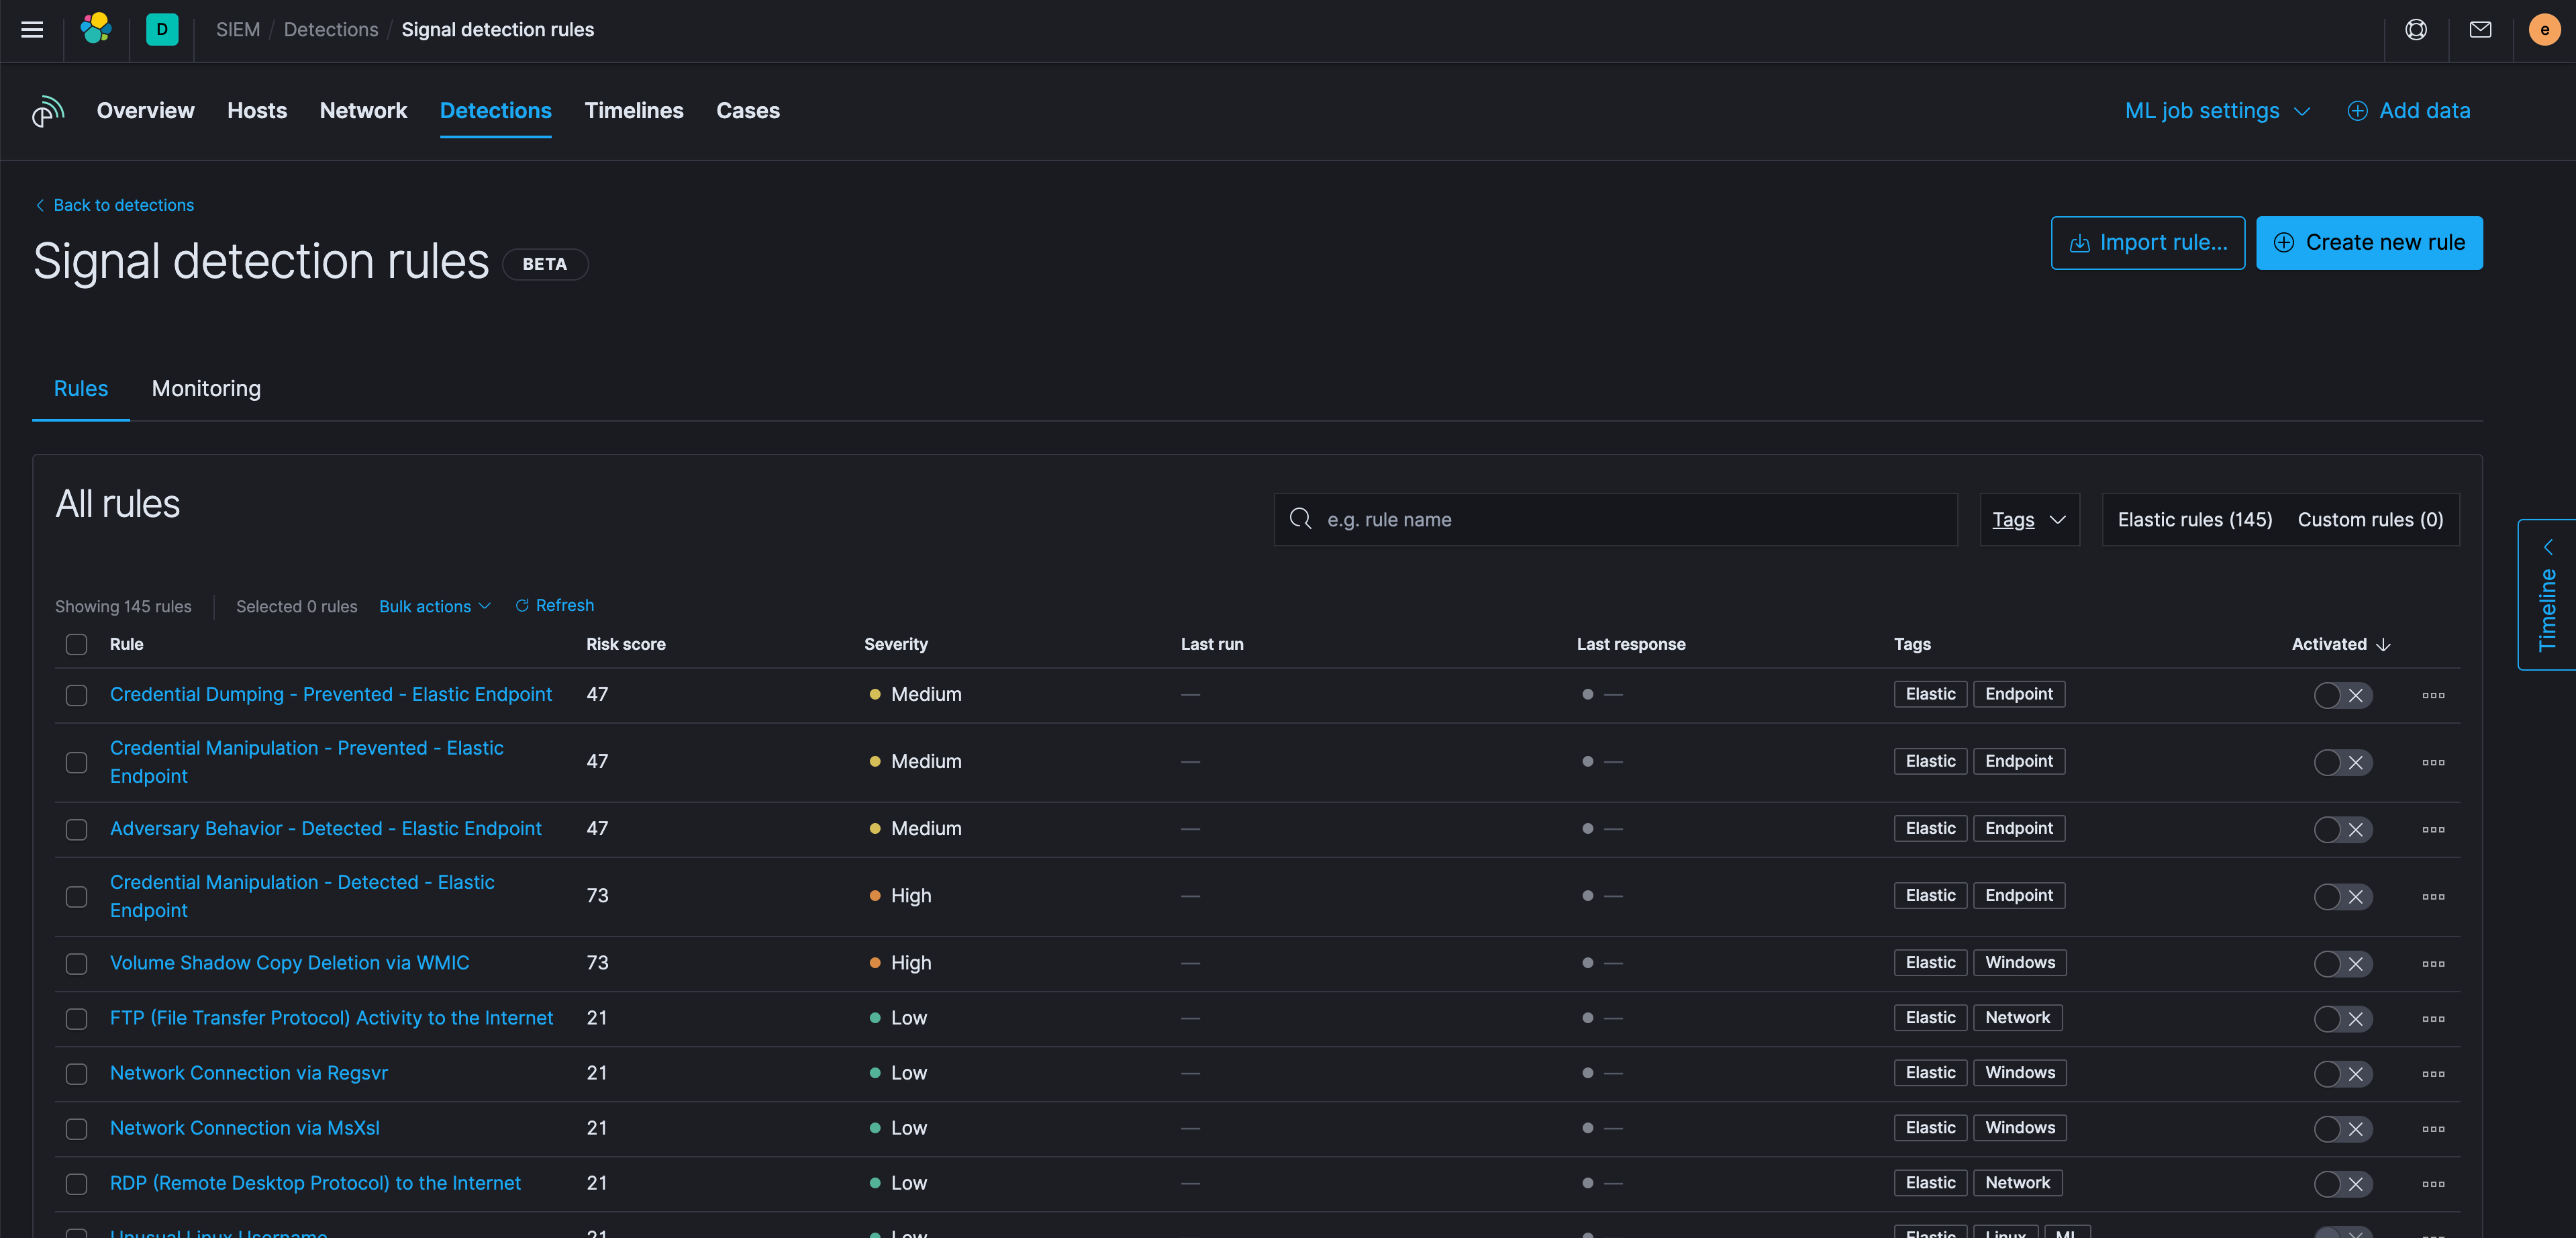
Closing Thoughts
If you’re looking for new detection rules, check out Elastic’s public repository. If you make a rule you like, please feel free to contribute it to the project!